Using Agrecalc with your pig enterprise

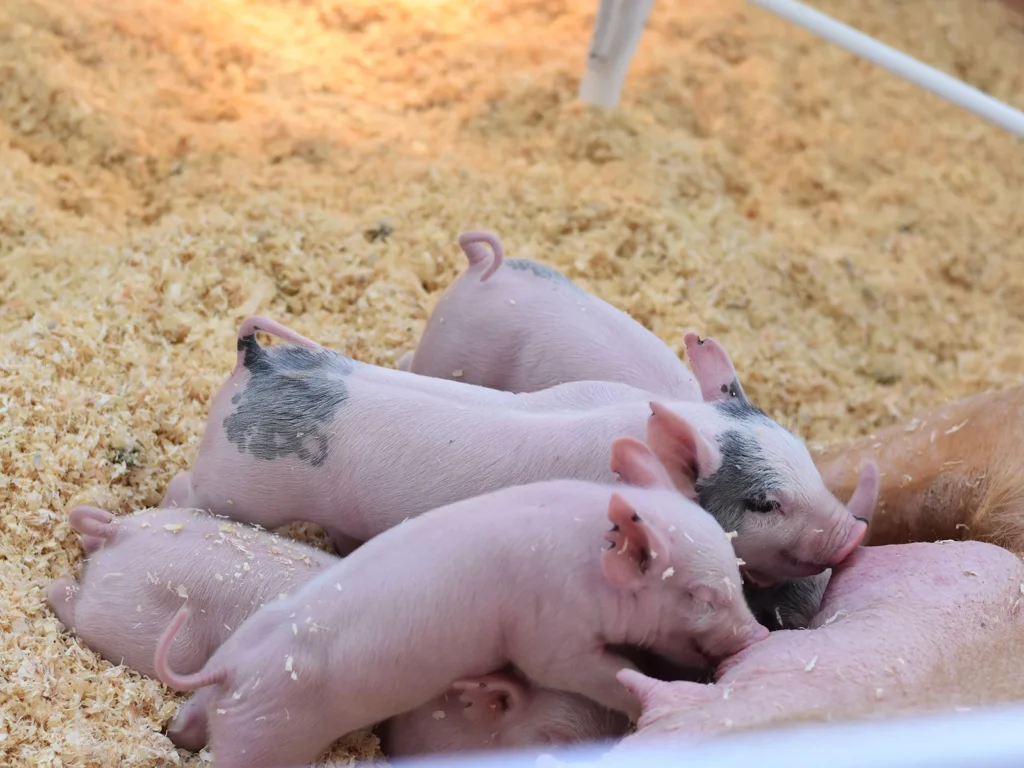
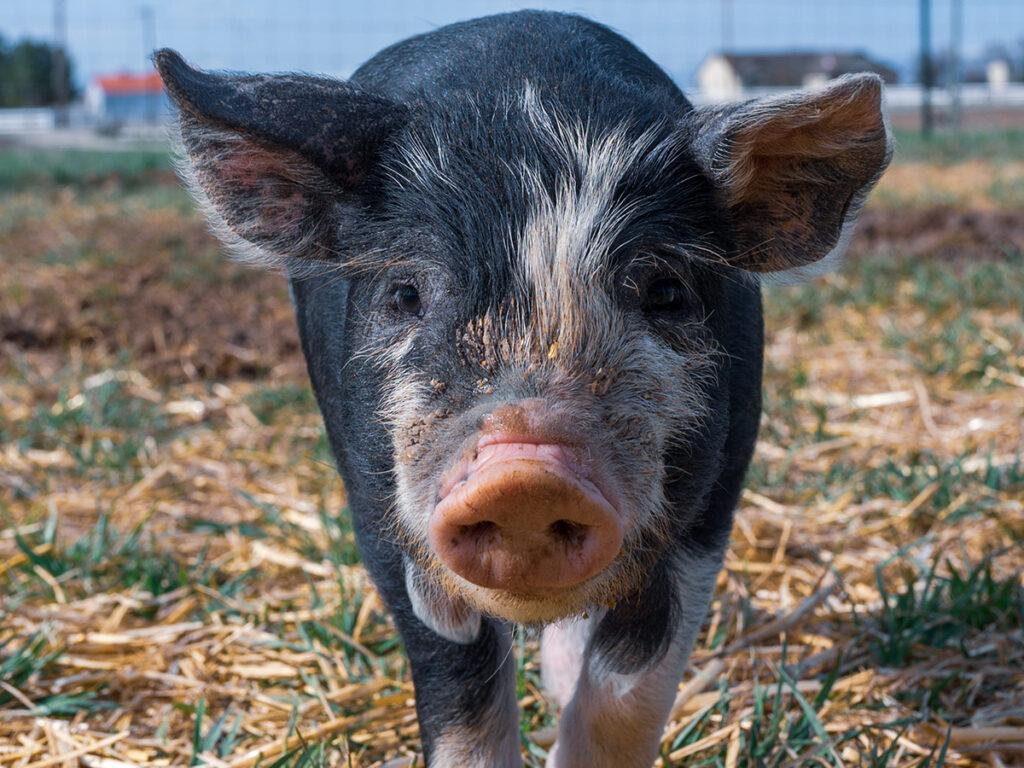
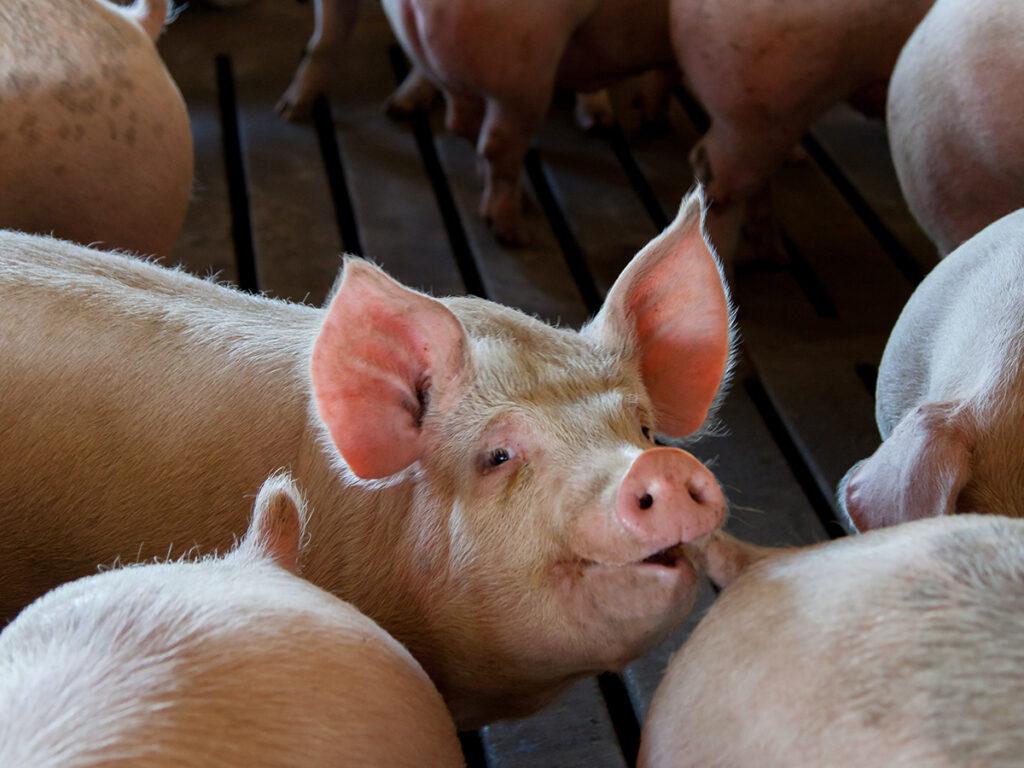
Calculating emissions from pig production

Greenhouse gases emissions from pig production are primarily Nitrous Oxide (N2O) which accounts for about half of all GHG emissions in pig rearing. The remaining emissions in these systems equally come from Methane (CH4) and Carbon Dioxide (CO2).

In comparison with beef and lamb, pig carbon footprint is generally half the footprint per kilogram of meat. Pigs possess a monogastric digestive system, leading to significantly lower methane production when contrasted with ruminant animals. 

However, extensive and especially intensive pork production utilises arable crops to produce food with far less efficiency than the direct consumption of those crops, which is something not seen in the production of ruminant animals. The ruminants are mostly reared on land which is otherwise unsuitable for alternative agricultural purposes – and as such that land is fit for sequestering carbon.

Historically, pig farming stood as an effective method of converting inedible food waste and by-products into consumables, but contemporary UK and EU regulations on swill feeding make this practice impossible at present.

The main amount of emissions in pig enterprises come from the following:

  • Feeding: the largest percentage of pig carbon footprint comes from the growing of pig feed, especially if we factor in soya grown overseas, which can have much higher emissions associated with its production. Agrecalc is looking into introducing separate coefficients for home-grown versus emissions-intensive soya products.
  • Manures, including storage, muck spreading and anaerobic digestion also form a large part of the pig carbon footprint. Mitigation strategies associated with proper management of manure can go a long way in reducing emissions associated with this issue.
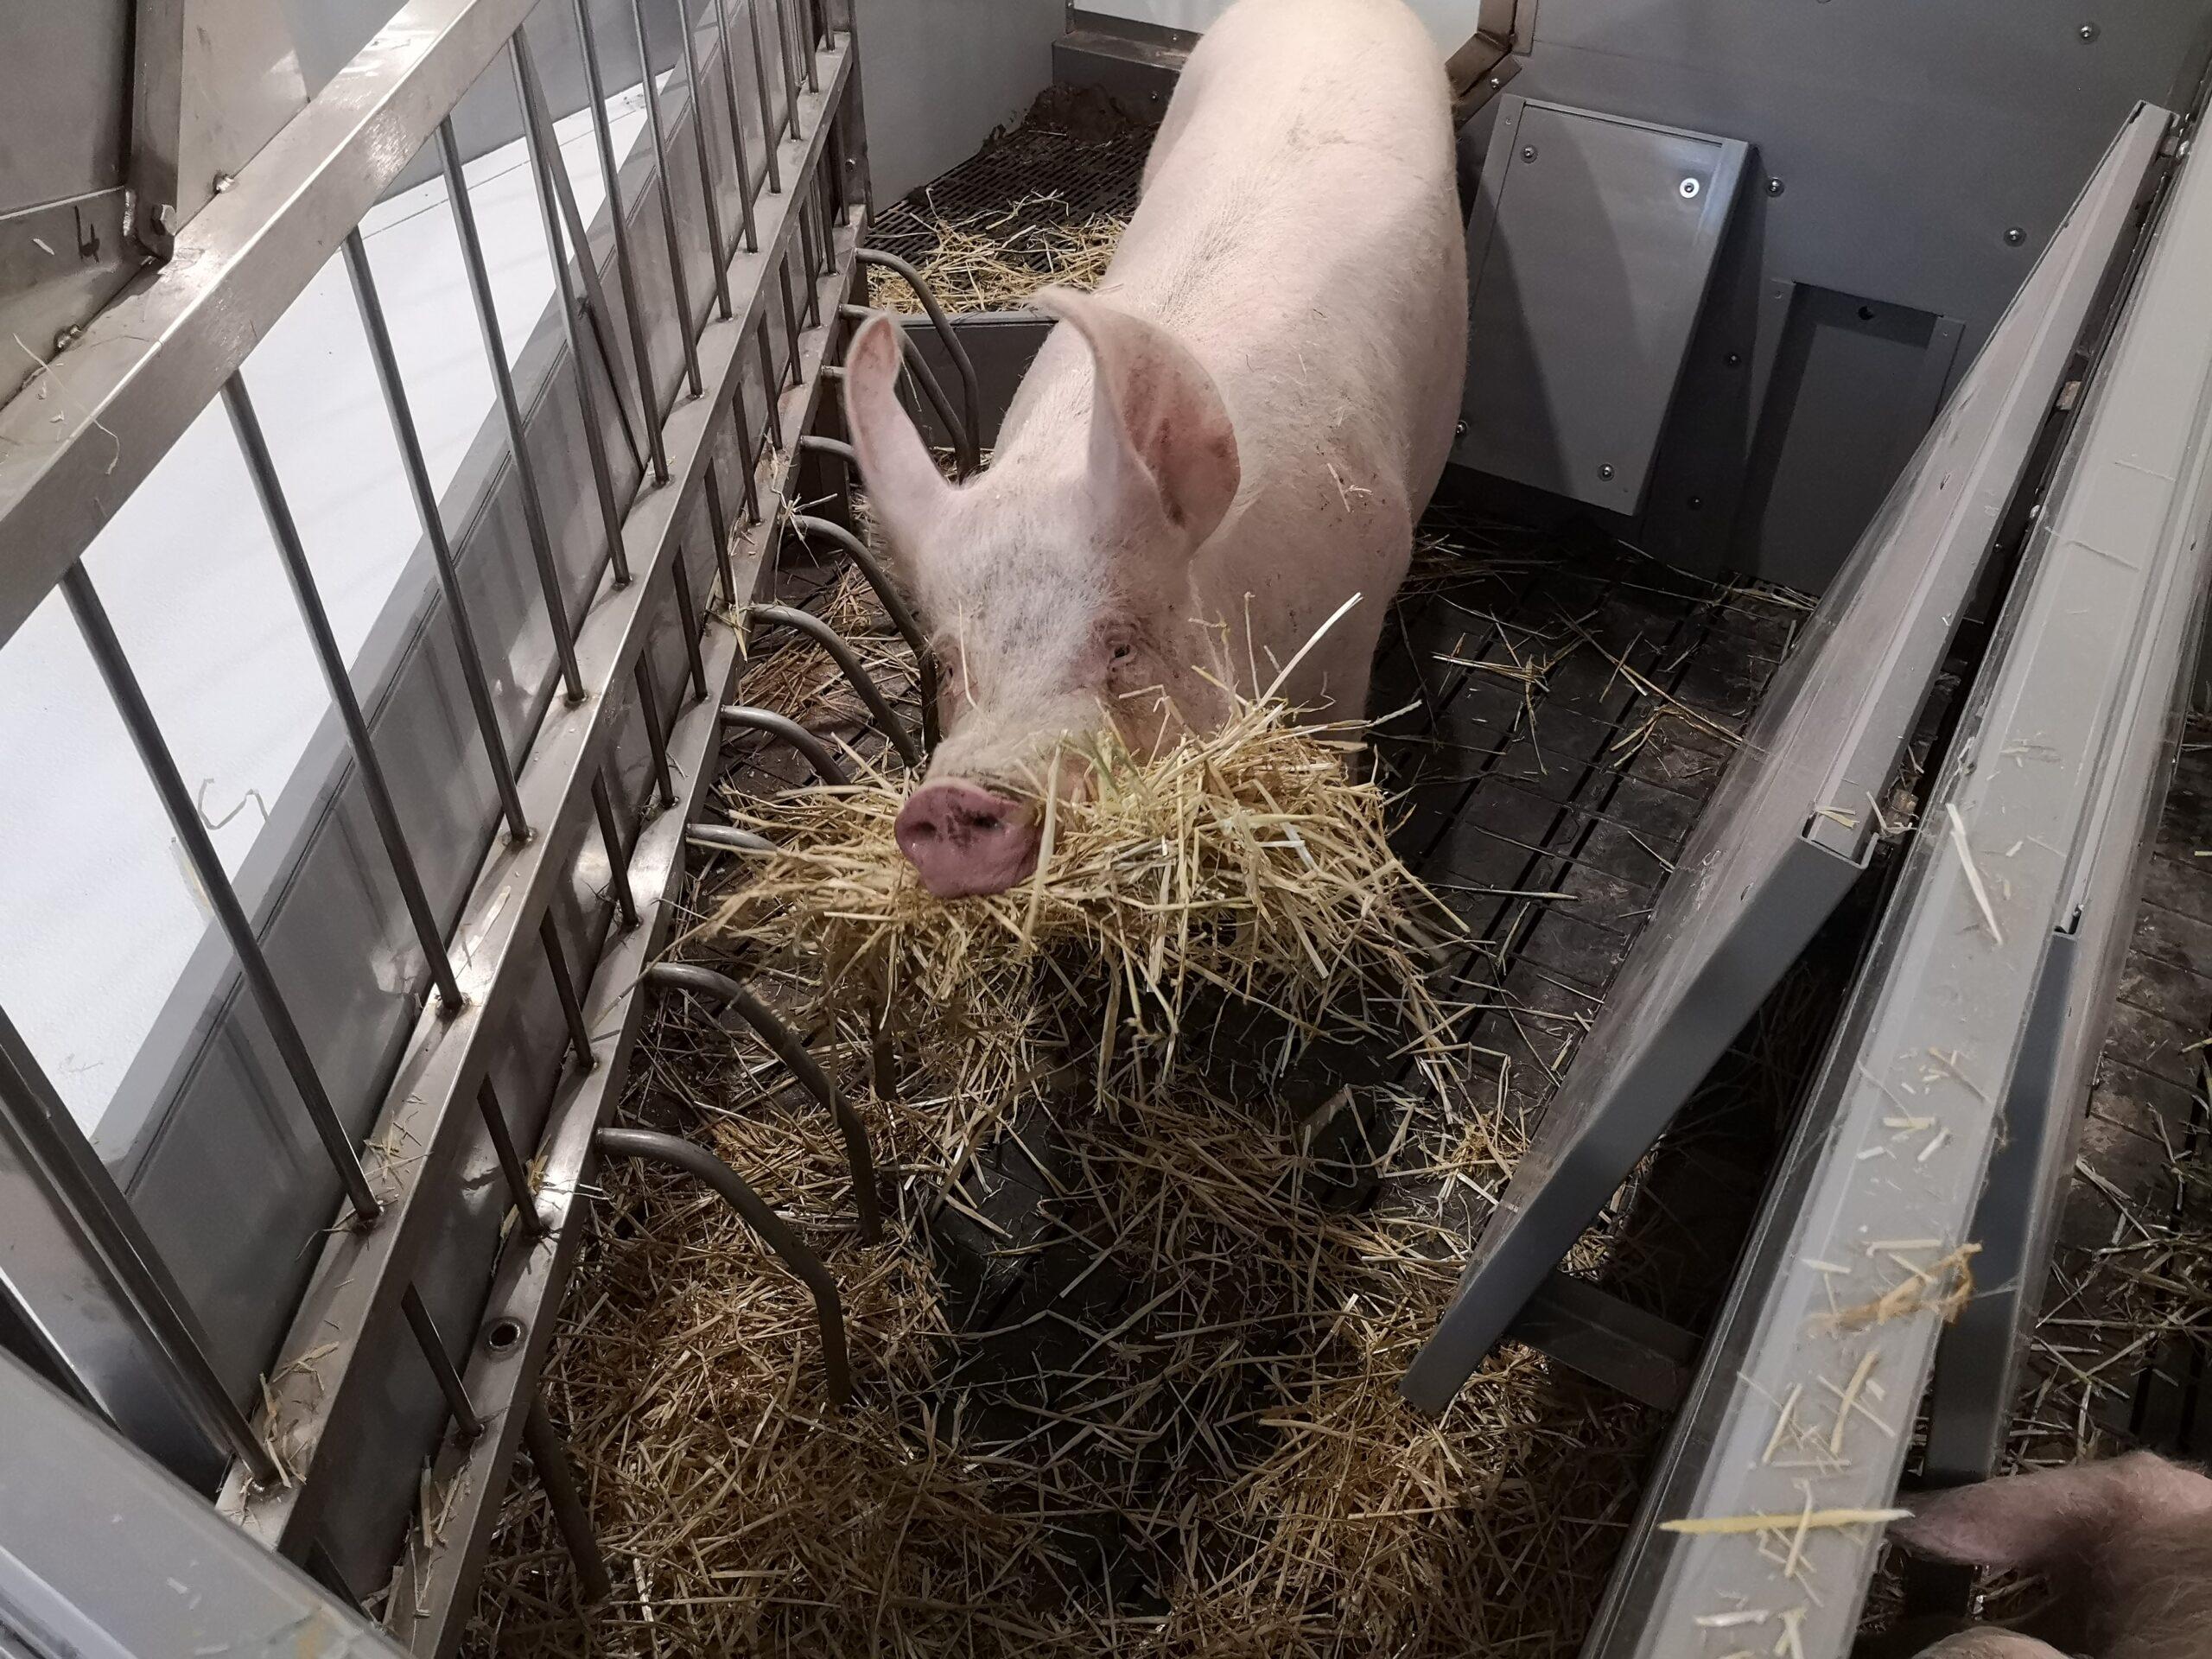
  • Energy: the more intensive the production system, the higher the direct energy requirements, in the shape of heating and ventilation systems. Altough this also accounts for the larger percentage of CO2 emissions, the potential for employing mitigation measures is also high, and can result in significant cost savings.

The Agrecalc Tier 2 calculations follow the GHG emissions methodology published in the Intergovernmental Panel on Climate Change (IPCC) and FAO GLEAM methodology for pigs and poultry. We are also certified to PAS 2050:20119 standards by approved verifier Lucideon, providing assurance that the GHG emissions being reported are calculated in a consistent way across the industry.

How to start calculating the GHG emissions from your pig production

To accurately estimate the emissions and sequestration from your pig enterprise, you will need to add data to the following three sections of the Calculator:

  1. Land and crops
  2. Livestock
  3. Energy and waste

To ensure data collected is accurate, use available farm records. Farmer estimates or industry default values can help fill any gaps.

Throughout the software, we have introduced automatic checks to help you with the data entry process: for example, you’ll see that certain cells are highlighted red. This indicates where all our entry fields must total at 100%.

When you calculate your pig carbon footprint, you can rely on the ‘auto-save’ mechanism that will automatically save your data every time you click ‘Next’. Alternatively, you can manually save the data by selecting ‘Save’ at the bottom of each page.

The Energy and Waste category requires data across the whole farm, and is not enterprise specific.

Data entry for accurate pig carbon footprint

At the start of your report, you have the options to select all the enterprises you’ve got on your farm. Grouping your pigs will help you to compare the results in your pig carbon footprint report. After having grouped them, you can start populating the data.

For each group, enter average daily live weight gains, number of piglets born per litter, number of piglets reared per litter and the numbers of litters per sow per year for the relevant pig classes. 

Average daily live weight gain is pre-populated with typical values that can be used in the absence of more specific data. To calculate daily live weight gain, you will also need birth weight and number of days until sale.

pig carbon footprint - sleeping pigs in straw

Ensuring optimum feed conversion efficiency for lowering pig carbon footprint

All homegrown feed and bedding used on-farm must be allocated across livestock enterprises. The total should be 100% for each crop enterprise.

When it comes to purchased feed, bedding and feed rations, enter the total quantity of each type of purchased feed and bedding used, in tonnes. For each feed / bedding imported to the farm, choose the category, and then select the feed type from the corresponding drop-down list.

Invoices can help check purchased quantities, but consider opening and closing stocks when calculating feed / bedding use for the reporting period.

If known, enter digestibility and crude protein percentage of the diet for each livestock age class.

For pigs, Agrecalc also requires gross energy and metabolisable energy from feed, to ensure a precise pig carbon footprint. If these percentages are not known, Agrecalc pre-populates these fields with typical values for the enterprise type that can be used in the absence of more specific data.

Scenario testing to optimise the ration formulation

One of the greatest challenges in reducing emissions from pig production is getting the ration formulation right. Reducing the amount of crude protein (CP) in the ration formulation can also have a positive effect on reducing N2O emissions.

Approximately 25–40% of all the nitrogen (N) contained in feed rations is converted into proteins and used in animal growth, and the other 60–75% is excreted. The higher the levels of N in the manure, the greater the potential there is for ammonia (NH3) emissions, resulting in higher N2O emissions.

With Agrecalc scenario testing, you can experiment with a diet with lower levels of CP. There have been a number of studies showing that reducing the CP level of the diet by 3% – and supplementing with appropriate amino acids – can result in a reduction of 30% less N excreted by the animal and up to 40% reduction in N2O emissions from the manures as slurry or solids.

Other factors can contribute to lowered production output. For example, SRUC has scenario tested various percentages of piglet mortality, and their influence on GHG emissions.

pig carbon footprint - pig's noses
pig carbon footprint - black and pink piglet

Manure management for decreasing pig carbon footprint

The proportion of GHG emissions from manure will depend on the system adopted and the weather, and can vary between farms and in each year. That is why year-on-year comparisons are very important.

There are three main factors to consider:

  • Storage: Adequate storage helps reduce pig carbon footprint, although the percentage varies, and doing a baseline audit, and subsequent monitoring of mitigation measures will provide best individual results.
  • Muck spreading: Proper application of slurries are cost effective ways of reducing dependency on artificial fertilisers, and a great way to improve soil health. Agrecalc helps farmers evaluate the efficiency of their nutrient application regimes, and monitor the effectiveness of actions taken on the farm.
  • Anaerobic Digestion: This manure management option has been added to Agrecalc Cloud, as well as the ability to utilise an integrated system for transferring manures from livestock to specific crops. This feature is meant to save farmers a lot of time when inputting data.

Pig enterprise Reports

When you reach the Reports page, you’ll have the ability to compare various groups within enterprises.

You’ll select your Report, then your enterprise and the group within it, and in the last drop-down column, you have different comparison parameters – like ‘farms with same enterprise’ or ‘farms in the top 25% of efficiency’. By selecting each in turn, the graph chart in the middle will change, informing you where you stand.

From there, you can make informed decisions about which mitigation steps to take to set your pig enterprise on a path of enhanced productivity.

pig carbon footprint - smiling pig

Need expert guidance in decision making?

Contact us today to learn more how we can support your work.