Here's some questions we often get asked
We hope the following common questions can help guide you through the Agrecalc journey. Any remaining questions about our data input fields are likely answered in the Agrecalc User Guidance after you log in. If you cannot find an answer to your query here, please contact us for additional support.
Q. G1. What emissions are included in Agrecalc?
A. G1. When calculating a carbon footprint, the system boundary is a dividing line that determines what is and isn’t included in the “system” being footprinted. An Agrecalc carbon footprint assesses a farm system that extends beyond the physical boundaries of the farm. It includes the
processes involved in sourcing and manufacturing resources used on the farm. This is generally referred to as a cradle-to-farm gate carbon footprint. In the language of the Greenhouse Gas Protocol, this includes the scope 1 and 2 emissions of a farm, as well as (most of) the upstream scope 3 emissions. Transport, processing, and packaging after products are sold off the farm (downstream emissions) are not included in our emission model at present.
Q. G2. What modelling methods does Agrecalc use?
A. G2. Agrecalc is committed to maintaining a consistent, defensible model of farm emissions based on the latest reporting standards and research. Agrecalc is based primarily on the International Panel on Climate Change’s Guidelines for National Greenhouse Gas Inventories. We use mostly Tier 2 modelling methods to estimate greenhouse gas emissions from all major on-farm sources and carbon sequestration. We also incorporate more specific national figures from the UK National Greenhouse Gas Inventory. We complement these standard modelling methods with data from scientific databases and other published research. More information on our model, please see our modelling methodology.
The detailed breakdown of how we use these methods is as follows:
- IPCC
Agrecalc currently base most of its models on IPCC guidelines and use IPCC emission factors in conjunction with emission factors from other databases.
Some of its models go beyond what is outlined in the IPCC guidance. Our livestock models are largely IPCC Tier 2 or beyond whilst our arable models are slightly simpler. As a rule of thumb, we aim to be at higher IPCC tiers for the most significant emission sources on farms.
2019 Refinement to the 2006 IPCC Guidelines for National Greenhouse Gas Inventories: https://www.ipcc.ch/report/2019-refinement-to-the-2006-ipcc-guidelines-for-national-greenhouse-gas-inventories
Task Force on National Greenhouse Gas Inventories IPCC Guide l National Greenhouse Gas Inventory: https://www.ipcc-nggip.iges.or.jp/public/2006gl
- PAS2050:
Agrecalc is PAS2050:11 compliant.
PAS 2050 Assessment of life cycle greenhouse gas emissions fact sheet.
Agrecalc Farm Carbon Reporting Methodology | |
IPCC Methodology compliant | IPCC (2019) Tier I and II methodology |
Publicly Available Specification (PAS) 2050 | PAS2050 certified (BSI, 2020) |
Livestock and Manure Management | IPCC (2019) Tier II methodology |
Fertiliser Applications and Crop Residues | UK National GHG Inventory 1990-2019; IPCC (2019) Tier I methodology |
Embedded Emissions Production of Fertilisers | Fertilizers Europe (2018) |
Emissions Imported Feed and Bedding |
|
Emissions Electricity and Fossil Fuels | DESNZ (fka BEIS) (2021) Emission Conversion Factors 2022; Comparison of Energy Systems Using Life Cycle Assessment; World Energy Council 2004 |
Carbon removals | Tier I IPCC (2019) |
Q. G3. What period of the year should the audit take place?
A. G3. To set up a report in Agrecalc, you will need to specify what month the audit starts and concludes on the farm report data entry page. This must be a 12-month period. Essentially, this can be done over any 12-month period in the year as long as it is consistent from year to year, so that subsequent years can be compared to the baseline. For example, some farms will align with the calendar year, or some might align with the financial year.
In future releases, we plan to allow audits for periods shorter than 12 months. This will be particularly useful for pig and poultry farms that operate on a shorter cycle. Farms with grassland or crops will align more easily with an annual cycle.
Q. G4. How do I interpret the results?
A. G4. There are several ways to view your results in Agrecalc. We currently include options to view results through a resource use and emissions table, comparisons, year-on-year results, charts and Agrecalc pdf reports.
The resource use and emissions table shows a line item and breakdown for every source of emissions across the whole farm and also for each individual enterprise and product. It includes all the relevant output figures from the entire report for reference. It can also be copied into excel for further modelling or data manipulation. The charts functionality displays data from this table in a more visual and digestible way. These two functions together can help you identify the major contributors to your greenhouse gas emissions.
The Agrecalc reports include KPIs and benchmarks, which are especially useful for interpreting results. The benchmarks allow you to compare your farm with similar farms in the Agrecalc database, demonstrating areas in which you excel and areas for improvement. The comparisons tool allows for placing two Agrecalc reports side by side and comparing each line item to examine any differences. This functionality is useful in a variety of modelling contexts. The year-on-year option allows a similar way side-by-side comparison of line-by-line changes over time.
Q. G5. How do you model a ‘What if’ scenario using Agrecalc?
A. G5. If you are a paid user, you can use this feature. Let’s take an example – say you want to model a 25% reduction in fertiliser use. On the farm home page, first create a copy of the baseline report. Then, enter the report input screens and reduce fertiliser quantity by 25%. Remember to hit ‘Save’. Next, use the ‘Comparisons’ page in the results section to compare the results of both reports side-by-side. It is advisable to initially model one variable at a time so that you can see the effects of each change in isolation.
Q. G6. What emissions factors are you using for your IPCC Tier 1 Forestry assessments, and is there a reason you haven’t chosen instead to use a Woodland Carbon Code model? Because this Tier 1 model is static, I suspect many of our places with mature “sink saturated” woodland will receive a very high sequestration value where something like the WCC would disagree.
A. G6. Our current version of our woodland assessment uses IPCC Tier I methodology which considers potential above-below-ground carbon sequestration potential according to woodland age, and category (conifer or broadleaf dominated). However, we do plan to utilise the UK Woodland Carbon Code model in 2025 which will better reflect the granularity of tree species, age and management practices.
Q. G7. Why do you use ‘tonne per fresh weight’ measurement for Crops, when you use kilogram (kg) as a measurement everywhere else?
A. G7. We aim to use units that are closest to those commonly used on farm – crops are usually measured / traded in tonnes. Farmers are usually asked: ‘How many tonnes to the ha did the crop yield? How many tonnes did you sell?’. And the answer will be, e.g., ‘8 t / ha (eight tonnes per hectare). The farmer is never going to say, e.g. ‘8,000 kg’. And when livestock are bought and sold, they are and measured in kg.
Q. G8. If one of our tenants in already part of the process, can we just get their permission to view their figures or do we need to enter the data again?
A. G8. You can access existing farm / Agrecalc user data with the permission of the farmer / data owner (this may be a Consultant, farm manager or processor). It is the responsibility of the project owner (you) to agree the process to gain written permission from the farmer / data owner. If the farm is part of another Organisation, we will add the farm to your Project.
We have processes in place for Project owners to ‘invite’ users into its Projects on Agrecalc Cloud.
Q. G9. Where tenants have already completed an Agrecalc independently or through FFRF, are we able to see / use this data? Presumably we would need to seek tenant’s permission to do this?
A. G9. As above.
Q. G10. When the LUFAs are collecting info for Agrecalc, do they look at just our owned land or do they include the farmers owned / rented land that supports the grazing?
A. G10. Agrecalc works at a whole farm level, so take into consideration all land used and inputs for the farm’s enterprises regardless of ownership. Where land is rented seasonally, it should be entered as seasonal land, and the annual occupancy alongside it. For example, if a 5 ha parcel of land is rented 6 months of the year, this would be entered as 5 ha seasonal land with a 50% occupancy.
Q. G11. What is definition of Biodiversity in context of forage details?
A. G11. The Biodiversity category in Agrecalc includes field margins, buffer strips including riparian buffers and Ecological Focus Areas (EFA) such as wild bird mixes that meet Greening requirements under biodiversity areas. However, areas of EFA nitrogen-fixing crops, catch crops and cover crops should be recorded under the most relevant crop types.
Q. G12. Is it better to do offline data collection and then input or to attempt direct input to the online tool?
A. G12. In many cases, the bandwith of a farms internet connection can slow down the inputting of data when done straight into the tool. It may be best to collect data offline for this reason. Additionally, if you ever need to revisit the data that has been input, you will have this as a hard copy.
Q. G13. If our tenants would rather enter the data directly at their own convenience, can they be given access to the system to do this?
A. G13. We are looking at a simple legal document that a farmer could fill in that would give us access to available data.
If the farm and report are created in the Organisation / Group / Project by a Consultant / Advisor, the farmer can be given access to the account by replacing any contact information (e.g. email address) in the farm licence account.
If the farm licence account already has the farmer’s email address, the farmer can access the account (resetting the password using their email address) at any time. If the farm licence is in the Organisation / Group / Project, all Consultants / Advisors can continue to access the information through their login.
If the farmer chooses to enter their own data, and initially create their account outside of the Organisation / Group / Project, you can send an email to info@agrecalc.com to ask the farmer for permission to add their farm. See Q. G8. for further details.
Q. C1. How does a farm allocate land that is rented out seasonally?
A. C1. Agrecalc is an LCA tool that seeks to assign the emissions associated with agricultural production effectively. Where land is rented out by the landowner, the guiding principle is that the carbon emissions are allocated to the farmer that generates the output. If the landowner or farmer rents land out to someone else, the emissions are passed to the third party and do not reside with the landowner (if they are not your sheep, they are not your emissions). The same applies to crops such as land let for potatoes – the landowner is not responsible for fuel and fertiliser that the potato grower applies to the crops.
Q. C2. How do I answer the ‘Number of years crop is in the ground’ field?
A. C2. This is the average length of time the crop is in the ground before it is ploughed and should be recorded in years. For annual crops, this value should be one, for other crops such as grassland the average time between complete sward renewals.
Q. C3. Does Agrecalc include the carbon stored in grass and crops grown on the farm?
A. C3. Carbon sequestration is the removal and long term storage of CO2 from the atmosphere. Although grass and other crops remove carbon from the atmosphere as they grow, most of that carbon returns to the atmosphere pretty quickly. That carbon is digested, either by humans and livestock consuming it, or microbes in the soil breaking it down. This is part of the natural carbon cycle, and does not generate additional long term carbon storage. However, cropland and grassland management practices can contribute to increases in soil carbon stocks, which is considered a long term carbon store. This sequestration is included in Agrecalc.
Q. C5. Is it possible for the tool to take peatland into account?
A. C5. Not at present – though we are working on a collaboration to take this into account. For now, some of our soil specialists have been doing survey work, following guidelines in the Peatland Code to calculate potential emissions savings from peat restoration. The next step for Agrecalc is to account for emissions from drained, cultivated peat soil. After that, we aim to add peatland restoration to the Agrecalc sequestration model.
Q. C6. How do I answer ‘Fraction of perennials / fallow in the rotation’ in the soil carbon inputs?
A. C6. This field asks what fraction of the rotation the field is under perennials / left fallow. Consider a longer time scale than the year in question for the purposes of the soil carbon calculations. For example, if every 2 years in 8, a field is sown with perennials grasses, the value entered would be 25%.
Q. C7. How do I input liquid fertiliser in Agrecalc?
A. C7. You can enter the N% in the usual fertiliser tab and convert from litres (L) to tonnes (t) by multiplying the quantity applied in L by 0.00128.
Q. C8. Are there standard figures for ‘% crop removed’ values for different crops?
A. C8. Yes, these can be found in the User Guidance Notes. (For User Guidance for Agrecalc Cloud, click here). If straw from cereals is chopped or incorporated, this should be factored in, as less of the crop is removed from the field. Adjust the proportion removed based on the yield of straw remaining but yield of grain being removed. See further instructions in the User Guidance. If standard figures aren’t included in the User Guidance, contact us and we can provide an estimate.
Q. C9. Why does lime have a large impact on my carbon footprint and how should I enter it?
A. C9. Lime application leads to direct soil emissions: lime releases carbon dioxide when it dissolves in the presence of water. Lime is also quite carbon intensive to extract and deliver as a product to the farm gate.
It is often the case that lime is only applied one in every four or five years. We recommend spreading the amount of lime applied across the number of years in which subsequent crops will benefit from the application.
Q. C10. On an organic farm that doesn’t use fertiliser, why do emissions against fertiliser appear in the emissions tables?
A. C10. This category includes Fertiliser and Lime – lack of space in table prevents full title being detailed there.
Q. C11. What is the meaning of the ‘Biodiversity’ land use category?
A. C11. Biodiversity area includes shelter belts, wetlands, wildflower meadows, and other natural areas which are not part of the farm production system but are kept in a natural state to support the natural landscape. Areas of bracken can also be recorded under biodiversity.
Q. C12. Fertiliser emissions in your output reports seem to be exclusively listed in the CO2 section of the report. I’m assuming this stems from a fertiliser LCA around production. Are there no assumptions in the existing model concerning N2O production as a result of fertiliser use, via nitrification / denitrification? I would have expected at the minimum an N2O allowance against IPCC Tier 1 methods – but very possible I missed something in the report?
A. C12. CO2 emissions in the report from inorganic fertiliser are from the embedded emissions associated with manufacture and transport. We use IPCC Tier II methodology to account for N2O production associated with the wider N cycling processes, including nitrification/denitrification/indirect N2O and leaching and are aligned with the UK GHG inventory emission factors.
It is possible that you missed this in the report as it is shown under a sub-section as follows (in the N2O part of the report – first two points):
Nitrous oxide | |
Volatilisation, leaching & run-off | Inorganic fertiliser and imported organic |
Manure input to soil | |
Grazing deposition, manure management | |
| And organic manure input to soil |
Vegetation, stubble & roots | Crop N residues |
| Total CO2e from nitrous oxide |
Q. C13. It doesn’t seem like its possible to enter peatland (degrading or otherwise) into the land cover bit of the assessment. For many NT farms, it is likely that peatland will form a large part of the emissions profile of a farm. Have I missed something, or is that still the case?
A. C13. Not yet, but soon. We will be releasing a peatland update to the tool in the coming months; this is based on the Peatland code inputs so will allow an input field for peatland condition status also. For now, there is the option to input area in hectares of peaty soil, before we release this further peatland module update to Agrecalc. We are also looking into adding saltmarsh as a land use category / option.
Q. C14. How do we account for annual variation in cropping?
A. C14. For grass silage where baled, users are commonly asked for number of bales a year and see if there is variation from one year to the next. For arable, tonnages per ha of product harvested are needed so this would cover the variation. The majority of time, it is worth asking if enough crop is produced on farm for feed as if not and feed is bought in then we would need this information for the bought in feeds as well.
Q. C15. Is there a good understanding of the ability of bracken to sequester carbon? Apparently its very good.
A. C15. Agrecalc doesn’t look at this level of detail including rough grazing to this extent at the moment. We would suggest record as a permanent habitat rather than commenting directly on the sequestration abilities of bracken.
Q. C16. With the potatoes and root vegetable enterprise, is this just for feeding purposes i.e., feeding sugar beet purchased from elsewhere, or only actually growing sugar beet on the holding?
A. C16. This can be done for growing and selling of products too. Adding the tons sold in Agrecalc will show this as an enterprise and the emissions for the products sold. Same with hay and silage.
Q. C17. How important is the differentiation between rough grazing and pasture grazing – what is the impact of this on the calculations?
A. C17. This needs to be as accurate as possible. Include fell land as rough grazing and then others, such as inbye, is included as pasture grazing. It can make a difference if the soil sequestration calculations are being used as the calculator will ask about the grazing of the land too which impacts on the end result.
Q. C18. Need to look at the details of how to record straw and muck in mixed farms. Also other imported organic materials e.g., biosolids and liming materials – do they make much difference?
A. C18. Yes, they do make a difference. For the manures applied, if the soil sequestration calculations are being used, then they need to be inputted in order for the calculations to work. Including these accurately, will show how much fertiliser a crop is taking on and if there are too many emissions from fertiliser use. Overall, as Nitrous oxide is a major component of the greenhouse gas emissions, we need to have this as accurate as possible as it could lead to results being out by a large margin.
Q. C19. Forage crop classification – what’s best option for species rich meadows for example(I would imagine permanent pasture)? Will future versions have more suitable options for the various habitats?
A. C19. If it is being grazed, then yes, use the permanent grazing option here. It may be in the future versions of Agrecalc we can look at this more specifically.
ISO Certification explained
Q: I have heard that software can be certified according to ISO standards. Could you tell me what that means?
A: Although Agrecalc is working towards obtaining an ISO certification as per requirements of the DEFRA Harmonisation report, in reality, being certified does not provide much added value. The images in the table below are from the documents easily obtainable on the Internet:
Extract from a certification document:
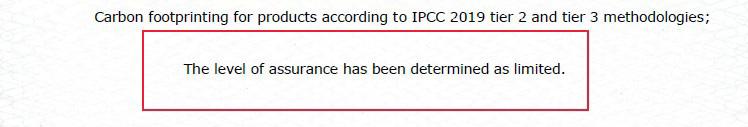
Meaning of “Limited assurance”:
The whole document can be found on the Greenhouse Gas Protocol website.
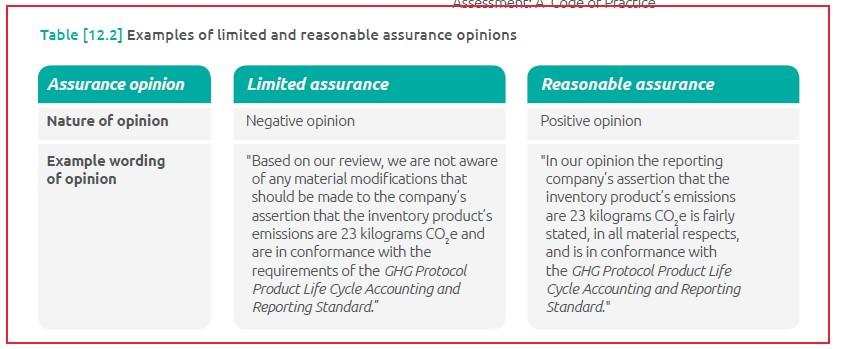
According to The Product Life Cycle Accounting and Reporting Standard document, page 96:
“Limited assurance” is actually a negative opinion – the assessor has found nothing to contravene the claims of the applicant, but hasn’t found anything that substantiates the claims either.
“Reasonable assurance” is a positive opinion. It means that the assessor has found that the applicant has gone beyond mere compliance, and has offered assurances that their claims can be fully substantiated.
Agrecalc is working towards obtaining Reasonable assurance.
Q. S1. What is the difference between soil carbon stocks and soil carbon sequestration?
A. S1. You can think of the soil as a bank account for carbon. Carbon stocks are the account balance, and sequestration is the profit or loss. Carbon is only being actively sequestered by the soil if the balance is increasing over time.
Soil carbon sequestration is calculated as the change in soil carbon stock estimates from one year to the next. Soil carbon stocks are determined by climatic factors such as temperature and moisture content, as well as mineral composition and soil texture (I.e. the relative proportions of sand, silt, and clay particles that make up a particular soil). Generally, the soil carbon stocks in the UK vary between 80–120 tonnes C per ha. Changes in the management of the land may affect whether these resting soil carbon stocks are maintained, increased, or depleted.
Q. S2. What is the difference between soil organic matter (SOM) and soil organic carbon (SOC)?
A. S2. Soil organic carbon (SOC) is a component of soil organic matter (SOM). Although the two soil properties tend to correlate, they are not the same. While soil organic matter testing provides a good indication of overall soil health and carbon storage potential, it is not sufficient for calculating soil carbon sequestration or quantifying soil carbon stocks for greenhouse gas reporting or carbon market payments. If you are just interested in knowing about the health of your soil and your carbon storage, soil organic matter testing might be sufficient. If you need more quantitative information on soil carbon sequestration potential, a soil organic carbon test to 30cm might be needed.
SOM makes up a relatively small proportion of the soil’s mass but plays a vital role in soil biological, chemical, and physical functions, such as soil structure and stability, regulating drainage and trafficability, buffering nutrient supply and sequestering carbon. SOM contains all organic material present in soil, including plant, microbial, algal, and animal materials in different stages of decomposition. It is a key store of nutrients such as carbon, nitrogen, phosphorus, sulphur, potassium, calcium and magnesium. SOM is the largest terrestrial reservoir of soil carbon – soil organic carbon (SOC) is a measurable fraction of SOM that contains carbon from organic compounds. Generally, SOM is made up of around 58% SOC.
Q. S3. It seems that the current methodology does not support carbon assumptions around arable reversion to low input grassland. Am I right in understanding that? That’s not to complain that it isn’t present – it’s a difficult thing to estimate – but I wanted to be clear that it is not something that forms a part of current assessments.
A. S3. We do use IPCC Tier I default stock change factors for land use change and conversion currently, but this specific scenario is something we are looking into to incorporate better into the soil carbon sequestration module in the future, where robust scientific evidence allows, as part of our wider “shift” and improvement of the wider soil carbon module to a Tier II approach.
Q. L1. What is the definition of digestibility used in Agrecalc calculations?
A. L1. Agrecalc uses the IPCC definition of digestibility: “The portion of gross energy (GE) in the feed not excreted in the faeces […] Feed digestibility is commonly expressed as a percentage of GE or as TDN (total digestible nutrients).”
Digestible energy is not exactly the same as metabolisable energy, as the latter refers to the portion of feed which is not excreted in faeces or urine. Guidance is included here https://www.ipcc-nggip.iges.or.jp/public/2019rf/pdf/4_Volume4/19R_V4_Ch10_Livestock.pdf starting on page 10.19, including guidance for default values.
Q. L2. If I am contract rearing dairy heifers how would I enter that in the tool?
A. L2. In this case you can just enter the animals in as beef animals that have been purchased in and then sold out again. As far as the model is concerned these are you cattle for the 18months or whatever period you have them for as your are farming them for this period.
Q. L3. What if my farm has multiple enterprise types e.g. different sheep flocks?
A. L3. In the current version of Agrecalc, just select the system type that represents the largest flock. In the new platform (to be released later this year), users will be able to separate multiple flocks under different management regimes in Agrecalc’s inputs.
Q. L4. Does the enterprise type selected affect the carbon footprint results?
A. L4. Enterprise system types are required for all livestock enterprises, and this data affects the typical values used in Agrecalc. This includes default weights, diet digestibility, and crude protein. If you do not select an enterprise type for a livestock enterprise, feed ration data will not be populated with defaults and emission calculations will not run as expected. System type data is also used for benchmarking purposes.
Q. L5. I wasn’t quite able to understand what goes in to your carbon assessment of feed. Is this a full cradle to grave LCA of feed? Does it include assumptions around land-based emissions through soil loss in arable cultivation? Does it account for feed based fertiliser CO2 & N2O emissions as a result of production? Or does this exclusively look at Scope 1 & 2 emissions such as diesel consumption & transportation? I’d like to understand any gaps here in case there is likely to be an underestimate that we should be aware of.
A. L5. We use the GLFI database which takes into account Scopes 1, 2 – so transportation values are included (global average figures). We will be releasing a new module soon which will allow a user to enter the composition of feeds into Agrecalc to create specific feed rations, the report will show with and without LUC, where applicable. We are PEFCR compliant for calculating carbon footprints of feed.
Q. L6. How does Agrecalc use 3NOP methane inhibitors for calculations?
A. L6. We currently allow users to indicate if 3NOP is being fed to cattle older than 1 year, and if so the fraction of the year they are being fed it. We use this to estimate the reduction of enteric methane emissions 3NOP feeding would result in. The reduction value we use is 10% which assumes a daily dosage in TMR.
Q. L7. A lot of our farms are very extensive with low stocking rates and inputs and late finishing, how does the overall land emissions balance against high emissions per DWKG?
A. L7. This will be dependant on farm type and how intensive the comparison is. Generally, the more extensive, the higher the CO2e per kg DW sold, but the lower the figure of CO2e per ha farmed and livestock unit is. Some of the most intensive dairies we have seen have 25,000 kg CO2e per ha and 12-15000 kg CO2e per livestock unit.
Q. L8. A lot of our upland farms have very extensive grazing with native breeds that are very slow growing, animals are generally sold store not finished, so they are producing a low volume of slow growing meat – their main ‘product’ is the management of their land for their environmental scheme. Will that meat appear to have a large carbon footprint as there is very little produced?
A. L8. We would suggest to record them as cows. But we are reviewing our approach to conservation grazing.
Q. E1. When calculating external haulage, would you calculate one way or round trip haulage for fertiliser, feed, hay, etc. delivered to the farm and how many trips would you include?
A. E1. Agrecalc calculates emissions to the farm gate – not beyond. The embedded emissions for inputs such as feed and fertiliser are assumed to include delivery to the farm gate. Therefore, external haulage figures should not include the transport of inputs onto the farm nor of products off the farm to their final point of sale / processing.
The intended role of external haulers in Agrecalc is to capture movement of livestock or crops within the farm business – for example, moving wintering sheep to distant rented grazings. Other transport using tractors is captured in the red diesel usage.
Q. E2. An arable farmer with their own lorry which hauls their own grain to the end buyer. Their white diesel usage is very high compared to the benchmark.
A. E2. The boundary for the Agrecalc emissions model is the farm gate. This farmer should exclude white diesel used by their own truck(s) for transporting grain from the farm to the end user.
Q. E3. If a farm has electricity usage that is partly conventional and partly renewable, is the usage that goes in the electricity box just the conventional usage?
A. E3. This is correct. The renewable usage should only be accounted for on the renewable electricity tab. The electricity use input includes electricity from the national grid or local conventional generation.
Q. E4. A farmer pays a renewable electricity tariff but the electricity is supplied by the grid. How should this situation be handled in Agrecalc?
A. E4. Regardless of the tariff paid, all electricity from the national grid should be entered in the electricity input rather than the renewables input box. This is in line with current best practice for greenhouse gas reporting, which states that the emission factor for grid electricity should be used regardless of the tariff paid. This avoids double counting emission savings reported by the energy company.
Q. E5. Often the same meter is used for the farmhouse and the farm business. Should I include the farmhouse electricity is the farm carbon footprint?
A. E5. Anything that does not contribute toward the final product that is sold off the farm or result in other farm output, is not included. Therefore, electricity for the farm house or any other heating fuel would not be included in the farms carbon footprint.
Q. E6. If I also do some contracting in addition to work on my own farm how do I account for diesel used when doing contracting work on other farms? Does this go on my footprint?
A.E6. If you do some contracting in addition to work on your own farm, you will need make a best estimate of how much of the fuel used was for work on your farm and how much was for work on another farm. Similarly, if you have a contractor do some work on your farm then you would need to estimate the fuel used by contractors and include that in your footprint.
Q. E7. How do you account for contractor fuel?
A. E7. The farmer may provide fuel already to the contractor for the work, in which case it is already included in the farm figures. If the contractor provided their own fuel, then there are some suggested fuel consumption figures available form AHDB.
Q. E8. Water usage – Agrecalc only takes into account mains water usage and not boreholes. I would be keen to know the amount of all water being used on farm?
A. E8. Agrecalc only needs to know how much mains water is needed, but any electricity or fuel used for the pumping of water from a borehole would be gathered in the energy figures already. The farm may have a flow meter too on the borehole supply.
Q. G1. Why are my emissions showing as zero?
A. G1. This can happen if an enterprise category has been omitted / unclicked on the first data entry page – “Farm Report Data Entry”. Ensure that all relevant enterprise categories have been ticked. For livestock enterprises, also ensure that a system type has been selected from the drop-down menu on this page. Then save your changes and view results again.
Q. G3. Why are my emissions showing as negative?
If feed ration data has not been entered for pigs or poultry nitrous oxide from grazing deposition, manure management and organic manure input to soil will show as a negative in the resource use and emission results.
If the total weight of purchases is greater than the total weight of sales in a given year, the carbon footprint will be negative due to a negative net output. To interpret the results, focus on the KPIs.
Q. L1. Homegrown feed use per cow or ewe is not showing in the enterprise reports.
A. L2. This could be because no crops (other than grazed grass) were fed or an entry was omitted in the “Fed or Used for Bedding” data input field.
Q. E1. Why are my energy emissions showing as zero?
A. E2. Check that the quantities entered in the whole farm data entry box have been allocated to the various enterprises and crops. The calculate button should be used to do this if enterprise level data is not available. If energy use is only entered in the whole farm data entry box, the emissions will not be calculated.