Advancing embedded emissions modelling for livestock
Collaborating with our harmonisation partners to advance embedded emissions modelling for livestock.
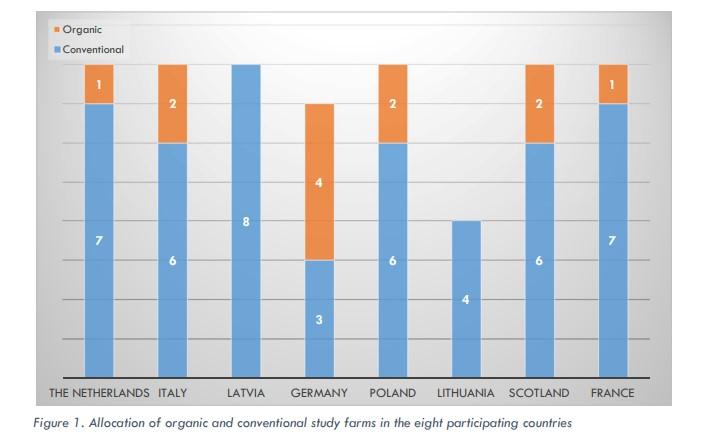
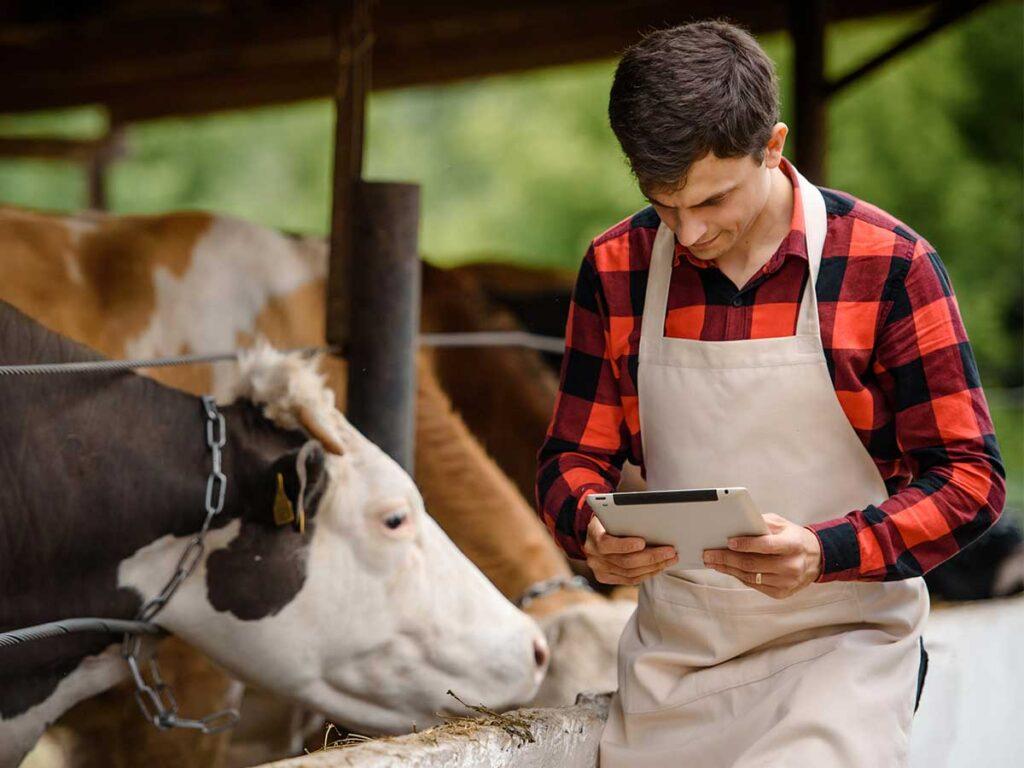
Climate Care Cattle (CCC) Farming Systems was a European project with a number of member countries from the Netherlands, France, Italy, Germany, Latvia, Poland and Lithuania, as well as Scotland’s Rural College (SRUC) in the UK, with farms that were mainly based in Scotland and to a smaller degree in the north of England.
The objective of the entire programme was to assess the mitigation factors on the farm and how they would relate to the methane and other greenhouse gas emissions. Primarily, it was looking at adaptations on farm to reduce methane among the dairy enterprises, however, mixed farms were also taken into account, depending on local circumstances.
There were 63% of the farms were lowland farms, 36% of farms were on more hilly terrain. Organic farms represented 20% of the farms included.
Relating to farm activity, dairy cattle accounted for 68% of the farms. However, for 19 of the farms other livestock was included with the most frequent being pigs (7 farms) then beef cattle (6 farms), sheep (4 farms), hens (2 farms) and poultry (1 farm).
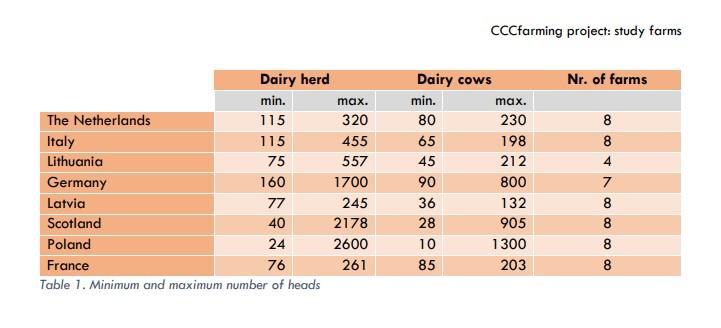
Considering the herd sizes of the farms 50% did not exceed 200 cows, with 40% of the farms having a herd size between 100 and 200 cows. However, 20% of the farms had large herd size with over 500 cows.
Part of the project was to compare the carbon footprinting tools available on the continent, with Agrecalc. This was considered as a result of Agrecalc’s partnership with SRUC and researchers Prof Bob Rees, and Dr Paul Hargreaves, who was kind enough to share the findings.
The datasets from 59 farms, from various localities and climate circumstances were collected, entered into Agrecalc, where multiple scenarios were run, and at the end, those adapted datasets were compared to the real data sets remeasured at the end of the two-year programme. There were eight farms per the participating country, with the exception of Lithuania that had only four farms, and Germany with seven.
The other tools in the study were the Dutch Annual Nutrient Cycling Assessment (ANCA) carbon calculator, developed by the Wageningen University in The Netherlands, and the French model CAP’2ER®, developed by Idele (The French Livetock Institute).
The period of data collection lasted from 2021 to 2022 with the intention to enable comparison to see if there’s were any differences with mitigation opportunities and reduction in greenhouse gases once they had been implemented.
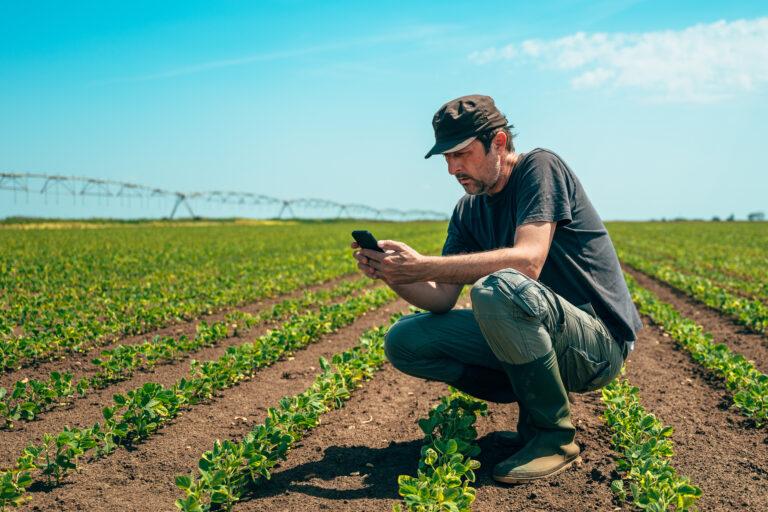
The project was looking for farms that were relatively innovative to start off with, or very interested in reducing methane and other greenhouse gas emissions and having their farms carbon footprint accessed. Agrecalc was put forward as the most versatile tool, able to deal with both livestock / dairy farms as well as mixed farms, although the project was mainly focused on dairy farming.
The focus of the comparison was to see how the data was collected, as well as how the reports could compare between the different footprinting tools.
“Just producing a list of numbers in a table is not visually very appealing, or quite as instant. When you suddenly have to compare numbers from two different tables, it can be quite taxing. Graphs are far easier to read and allow for information to be absorbed quickly. The coloured bars are useful for getting the messages across succinctly, without a lot more explanation. You don’t need to know a lot about working in Agrecalc to see that the changes you made, the changes that were suggested, are working – the result depicted by the bar chart show the reduction from what it was initially.”
Dr Paul Hargreaves , Senior Researcher in Soils and Forage, SRUC
There was a degree of agreement between Agrecalc and the French and Dutch models, but there were also divergences, due to the application of various IPCC tiers in the treatment of the data entered into the calculators. Some of the calculators worked on a more granular level than Agrecalc.
Agrecalc was also useful in enabling simulations / scenarios, especially when it came to the methane content, based on data inputs from the farms in agreement with farmers in relation to their forage mixtures.
Due to certain limitations of the Dutch model, some of the broader areas of modelling potential change on farms represented a struggle to deliver the outputs. When it came to observing changes in the methane levels, Agrecalc came out as the more versatile tool, as ANCA was initially developed to be a phosphate-model only. It later expanded into methane and other aspects, but as a primarily dairy model, it struggled with the versatility of other enterprises on a farm. Although some of the farms in the project were strictly dairy farms, others offered a broader choice of enterprises – with a mixture of arable crops and other livestock as well.
Some of the challenges the science team faced was the number of parameters they could assess as mitigation scenarios. Keeping these simple was important, as for example, if the number of cows changed dramatically, or if a calving interval was reduced, it would also reduce the number of calves, as well as have an effect on the amount of feed grown and bought in along with changes in slurry production and fertiliser use.
In the end, there were 14 scenarios tested – mostly relating to slurry and how it was treated; also tested were reductions in bagged fertiliser, changes in the clover content, and some changes in feeding a feed additive to reduce methane.
The outcome was an indication for the farmer – if they went down the route of putting a particular mitigation into place, how much methane and other GHGs would be reduced on their farm.
“We had a lot of good contact with the Agrecalc team, especially when it came to checking what we were doing was reasonable and sensible, and answer the questions about certain outcomes as well. I am not a dairy nutritionist by any stretch of the imagination, my specialty are soils and forage”, Dr Paul Hargreaves says.
In Latvia and Poland, Agrecalc received a particularly enthusiastic welcome, where the participating institutions were also using it as a teaching tool, where students were tasked with inputs, dataset manipulation and observing the changes arising from scenario-testing.
Compared to other tools, Agrecalc was viewed as a far more versatile, where farm inputs could be manipulated easier, and the results were clearer to read.
One of the other aspects of the tool that proved advantageous was the data visualisation. The graphs that Agrecalc produced was favoured among the users, as they deemed them useful, especially when comparisons were conducted.
“Just producing a list of numbers in a table is not visually very appealing, or quite as instant”, says Paul Hargreaves from SRUC. “When you suddenly have to compare numbers from two different tables, it can be quite taxing. Graphs are far easier to read and allow for information to be absorbed quickly. The coloured bars are useful for getting the messages across succinctly, without a lot more explanation. You don’t need to know a lot about working in Agrecalc to see that the changes you made, the changes that were suggested, are working – the result depicted by the bar chart show the reduction from what it was initially.”
“If Agrecalc was no longer available, a lot of people would be very disappointed”, says Paul. “It is about the simplicity and the availability of data that is asked from a farmer. It is more likely that the data you use is the data you’ve already got on file that you can pull together.
“For comparison’s sake, what I gathered from the users was that the Dutch model seemed to be a lot more involved, and you’d need a lot more information, especially on the feedstock – the parameters their tool asked for were a lot more detailed.”
There was a challenge with the soil carbon module, which eventually led the Latvian team to abandon it because it was too Scottish oriented, and it was difficult to adapt to their local requirements. However, new developments are made through collaboration with European colleagues to adjust the coefficients according to specific country’s needs and testing is planned to put this into practice in the coming years.
“I was quite interested in some of the more basic outcomes of the soil emissions and soil sequestration and how that was working. So, I had a number of questions for the Agrecalc team, and the collaboration on getting those answers was very good. I also hope my questions helped in furthering the tool’s development, as no two farm systems are the same, so those scenarios came in handy when the conversation steered towards the soil sequestration module. Collaboration with the Science and Research team was excellent, and I hope useful to both of us.
“On the back of it, our programme participants were quite enthusiastic about Agrecalc, and they have lots of questions about further developments, and the Agrecalc team was able to help them out with those, and although this project has come to an end – bar for a few economic discussions – the collaboration remains on a European level”, concluded Dr Hargreaves.
The full report from the project Is available from the Climate Care Cattle project website.
A general description of the CCC Farming program is also available on their website: Climate Care Cattle Farming Systems | The Project (cccfarming.eu).
Collaborating with our harmonisation partners to advance embedded emissions modelling for livestock.
After two years of operation as a Limited Company, Agrecalc became part of Scotland’s Rural College (SRUC) as of 1 April 2025.